

Performance
Transparent. Documented. Timestamped.
Soundmark Capital Research is a rules-based market risk model designed to identify market risk regimes and inform defensive positioning.
The Model Gets Defensive When It Matters Most.
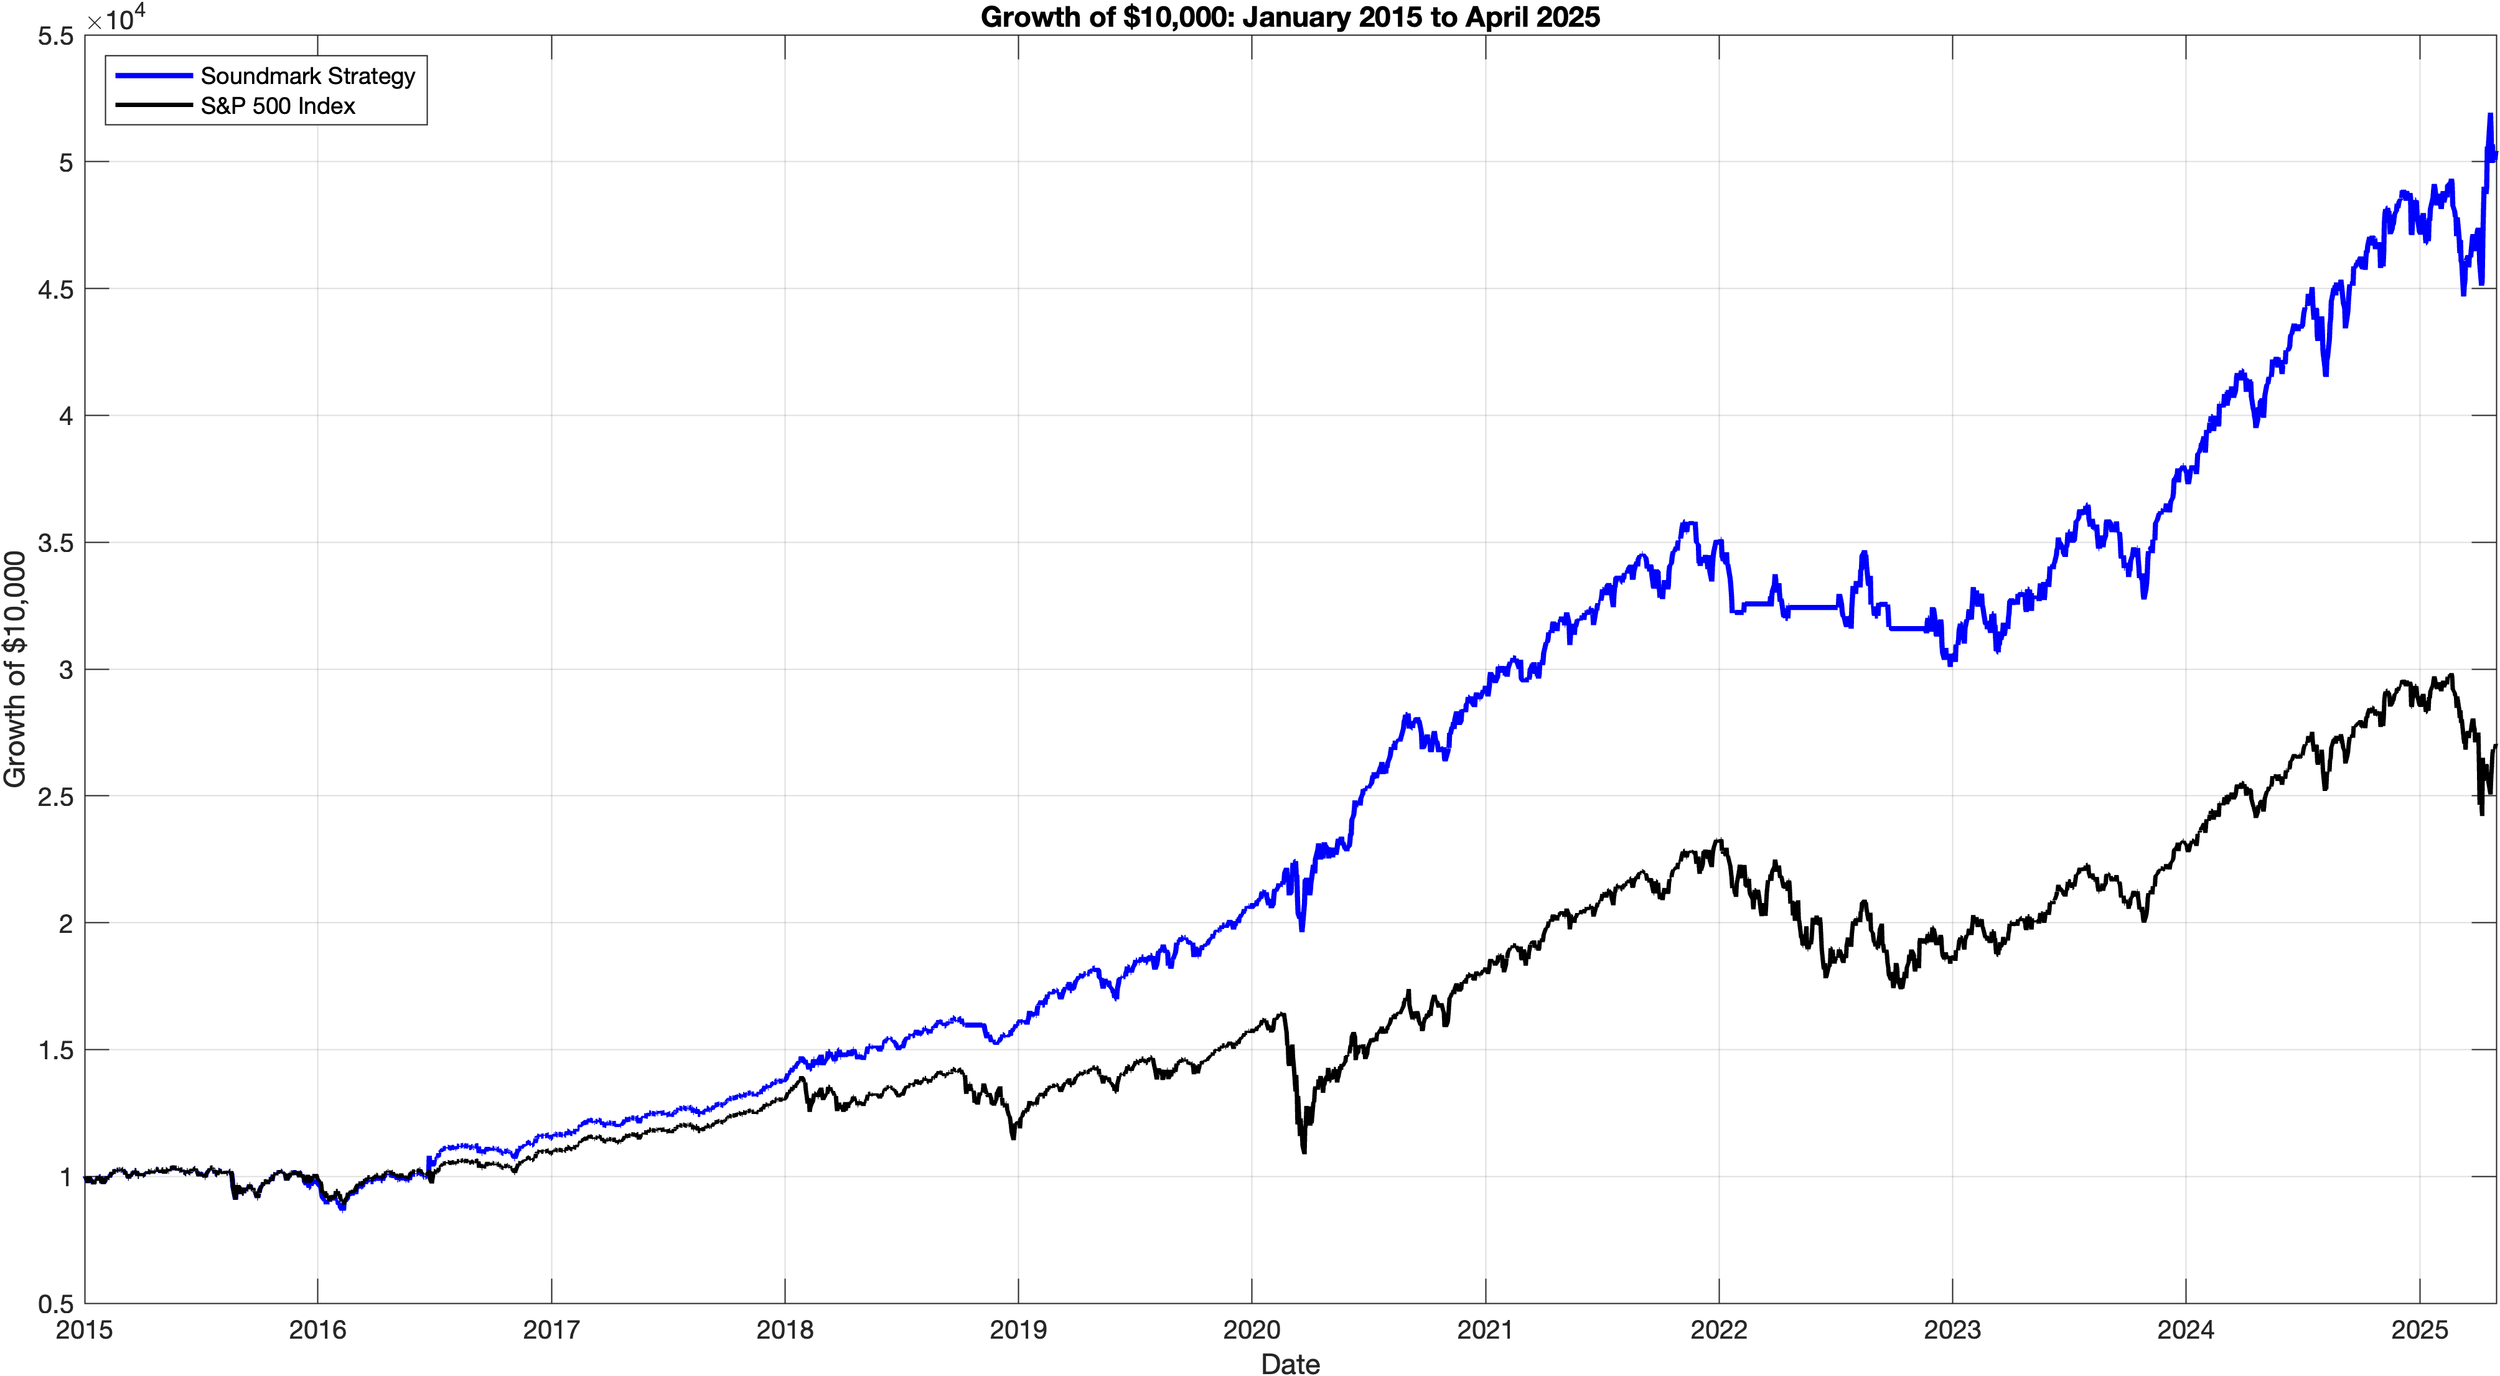
In its strongest defensive years, 2018, 2020 and 2025, equity beta fell to 0.49, 0.14 and 0.42, while the model generated 15.8%, 28.0% and 11.9% alpha, respectively.
-
Live Start Date
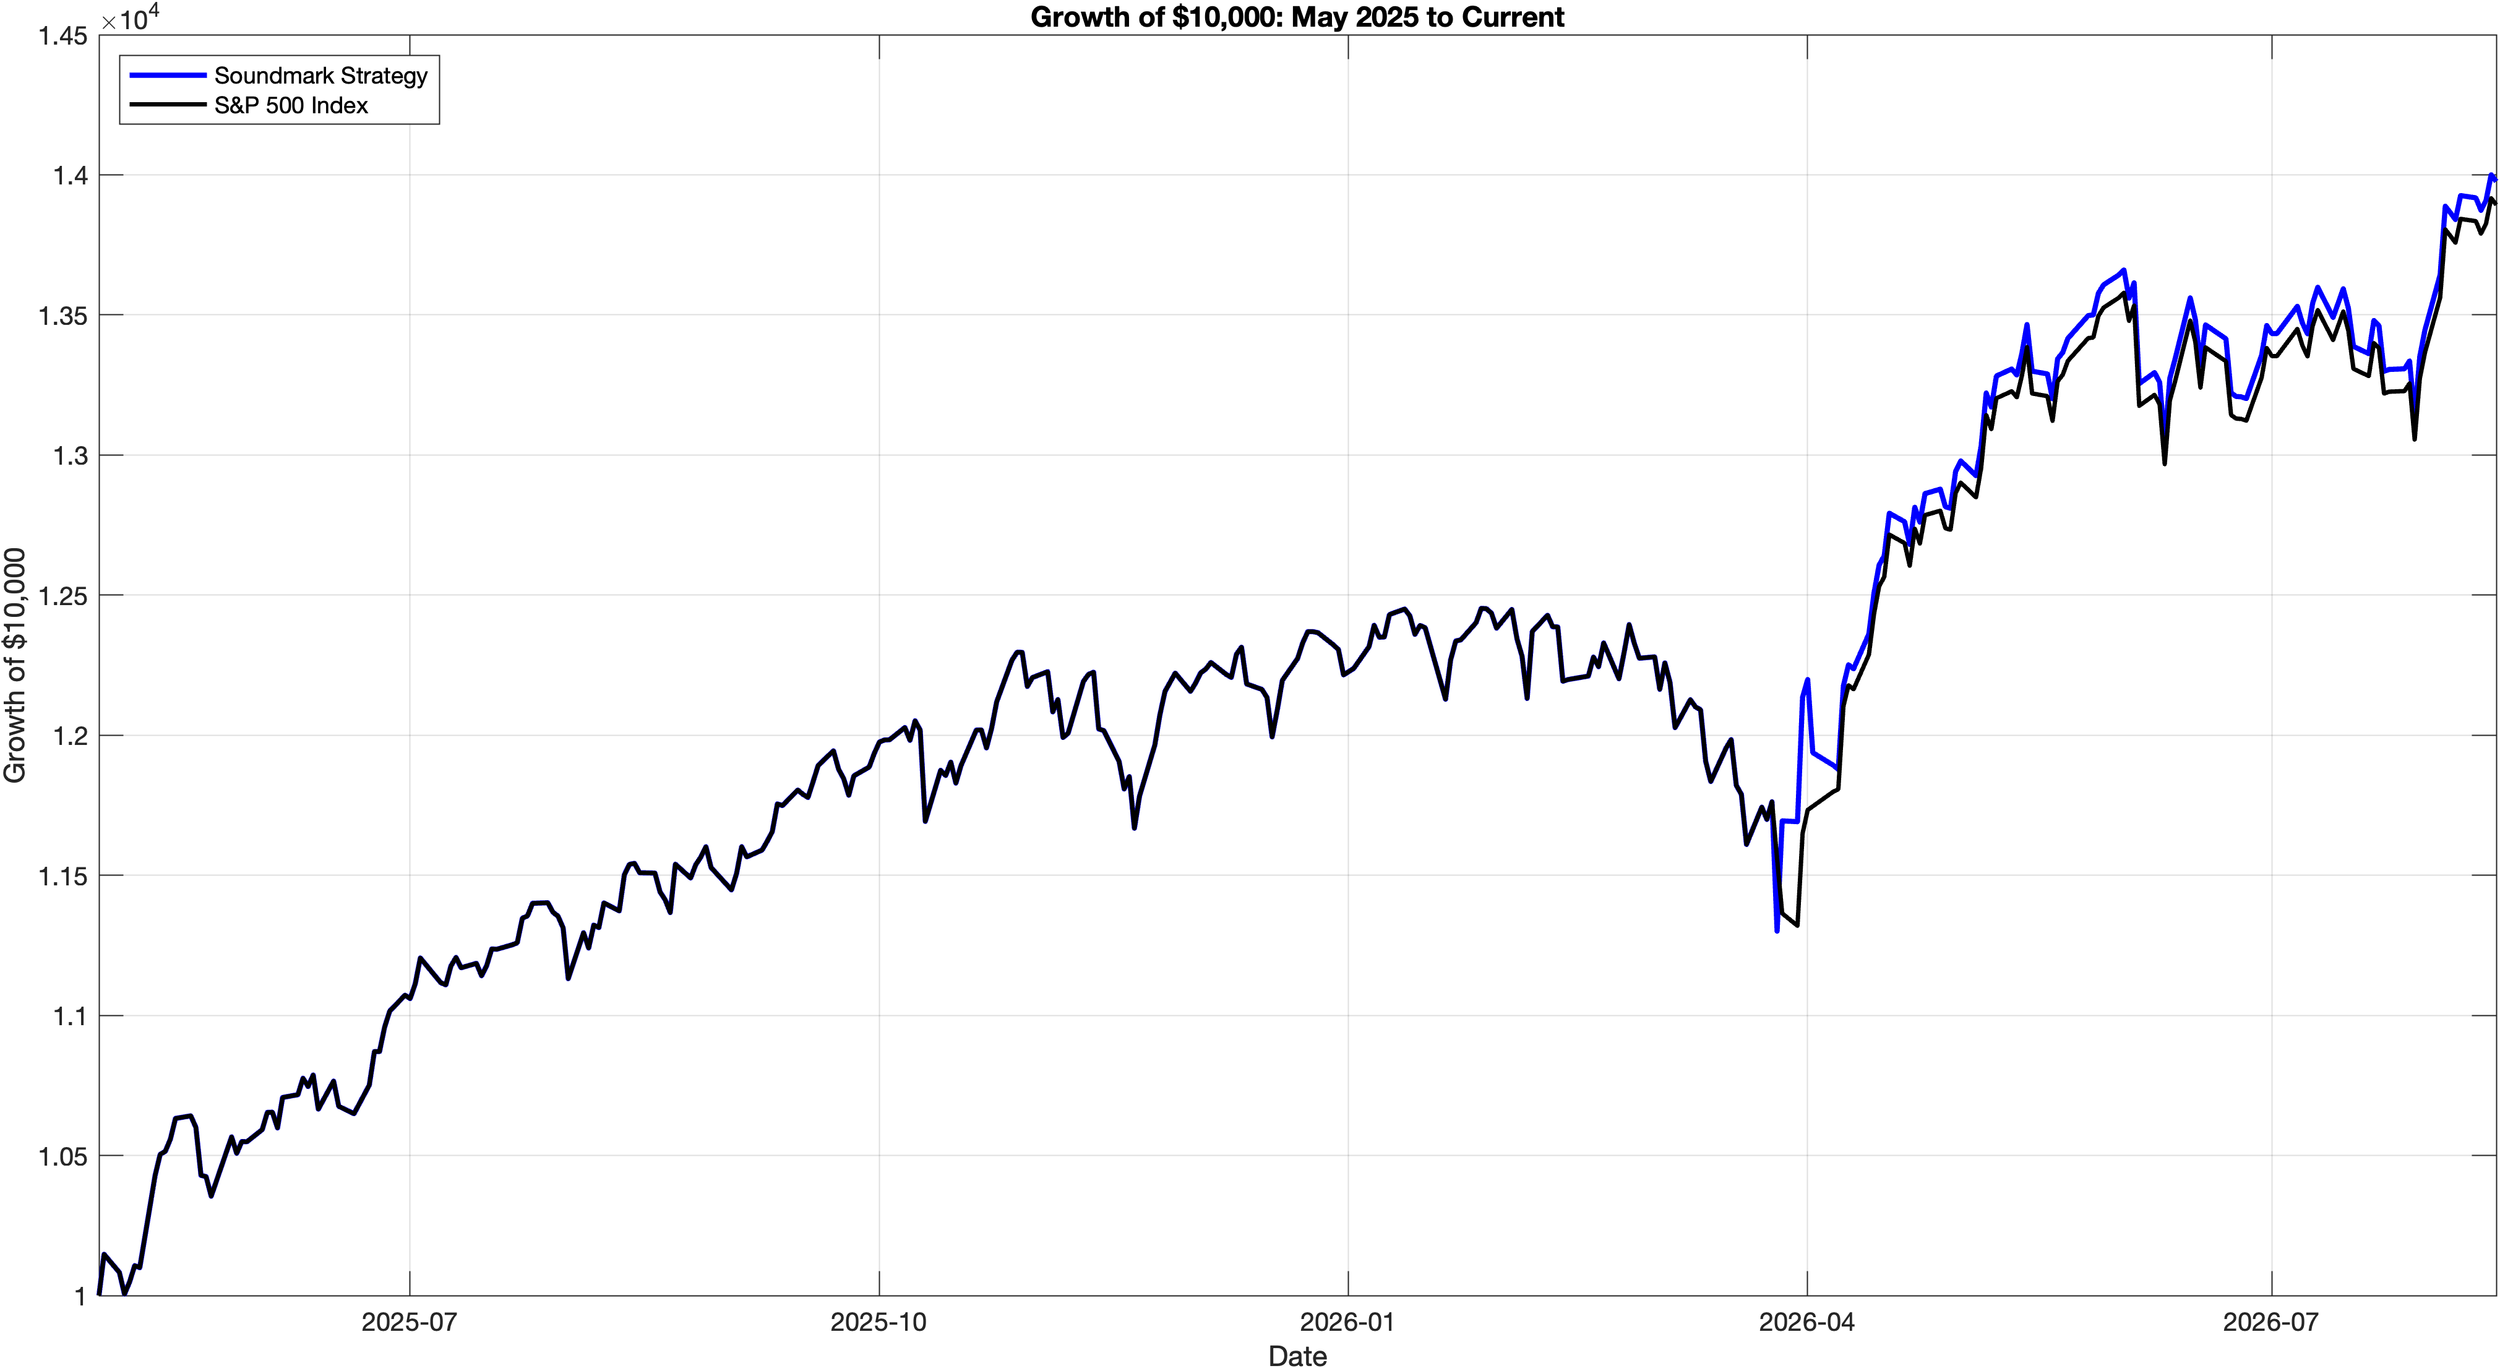
May 2025
-
Cumulative Return
39.76%
-
Annualized Return
29.71%
-
Ann. Volatility (Strategy)
13.6%
-
Sharpe Ratio (Strategy)
1.92
-
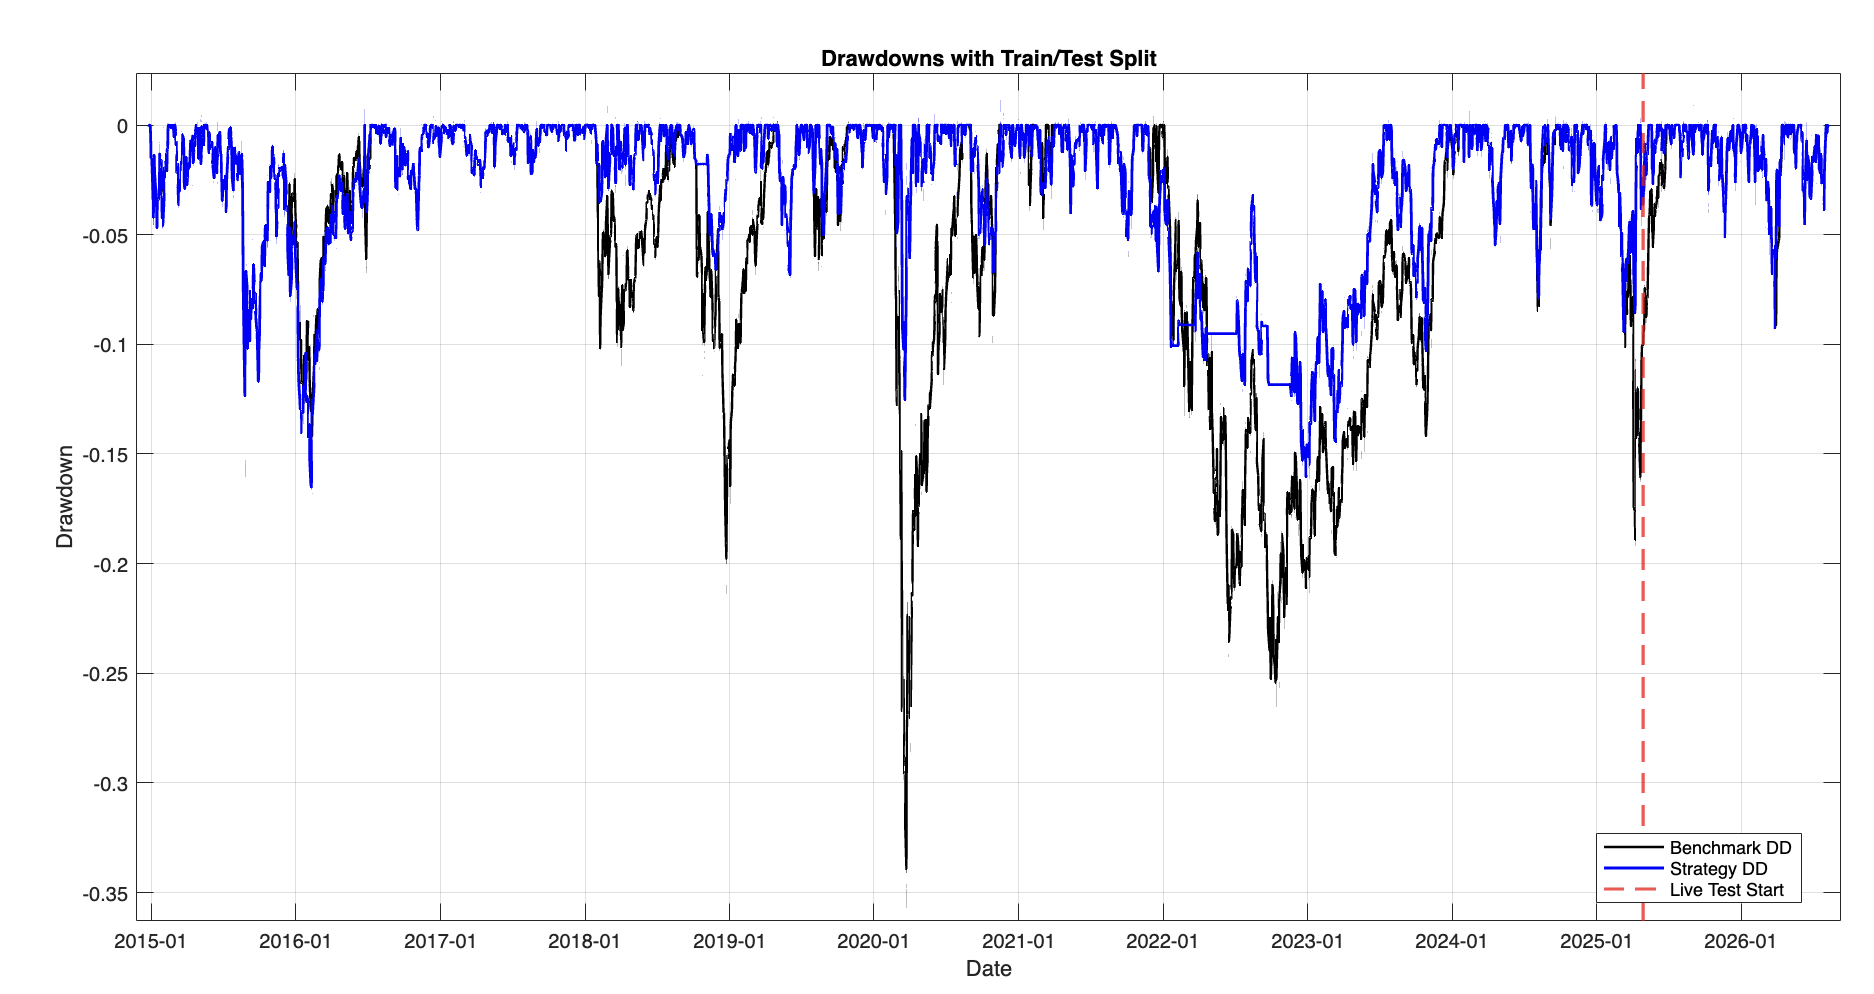
Max Draw Down (Strategy)
-9.25%
Backtest | Jan 2015 - April 2025
Growth of $10,000 | Strategy vs. S&P500
####
Live Start | May 2025 - Present
Growth of $10,000 | Strategy vs. S&P500
####
Max Drawdown
Strategy vs. S&P500
####
Monthly Returns

Research Studies
-

Rotation Model - Equities vs. Gold
####
-

Stress Tests
####
-

Model Change Log
####
-

Disclaimers
####